
Live Data
Climate Dashboard
Multi-source viewer for observed climate trends and future CMIP6 projections.
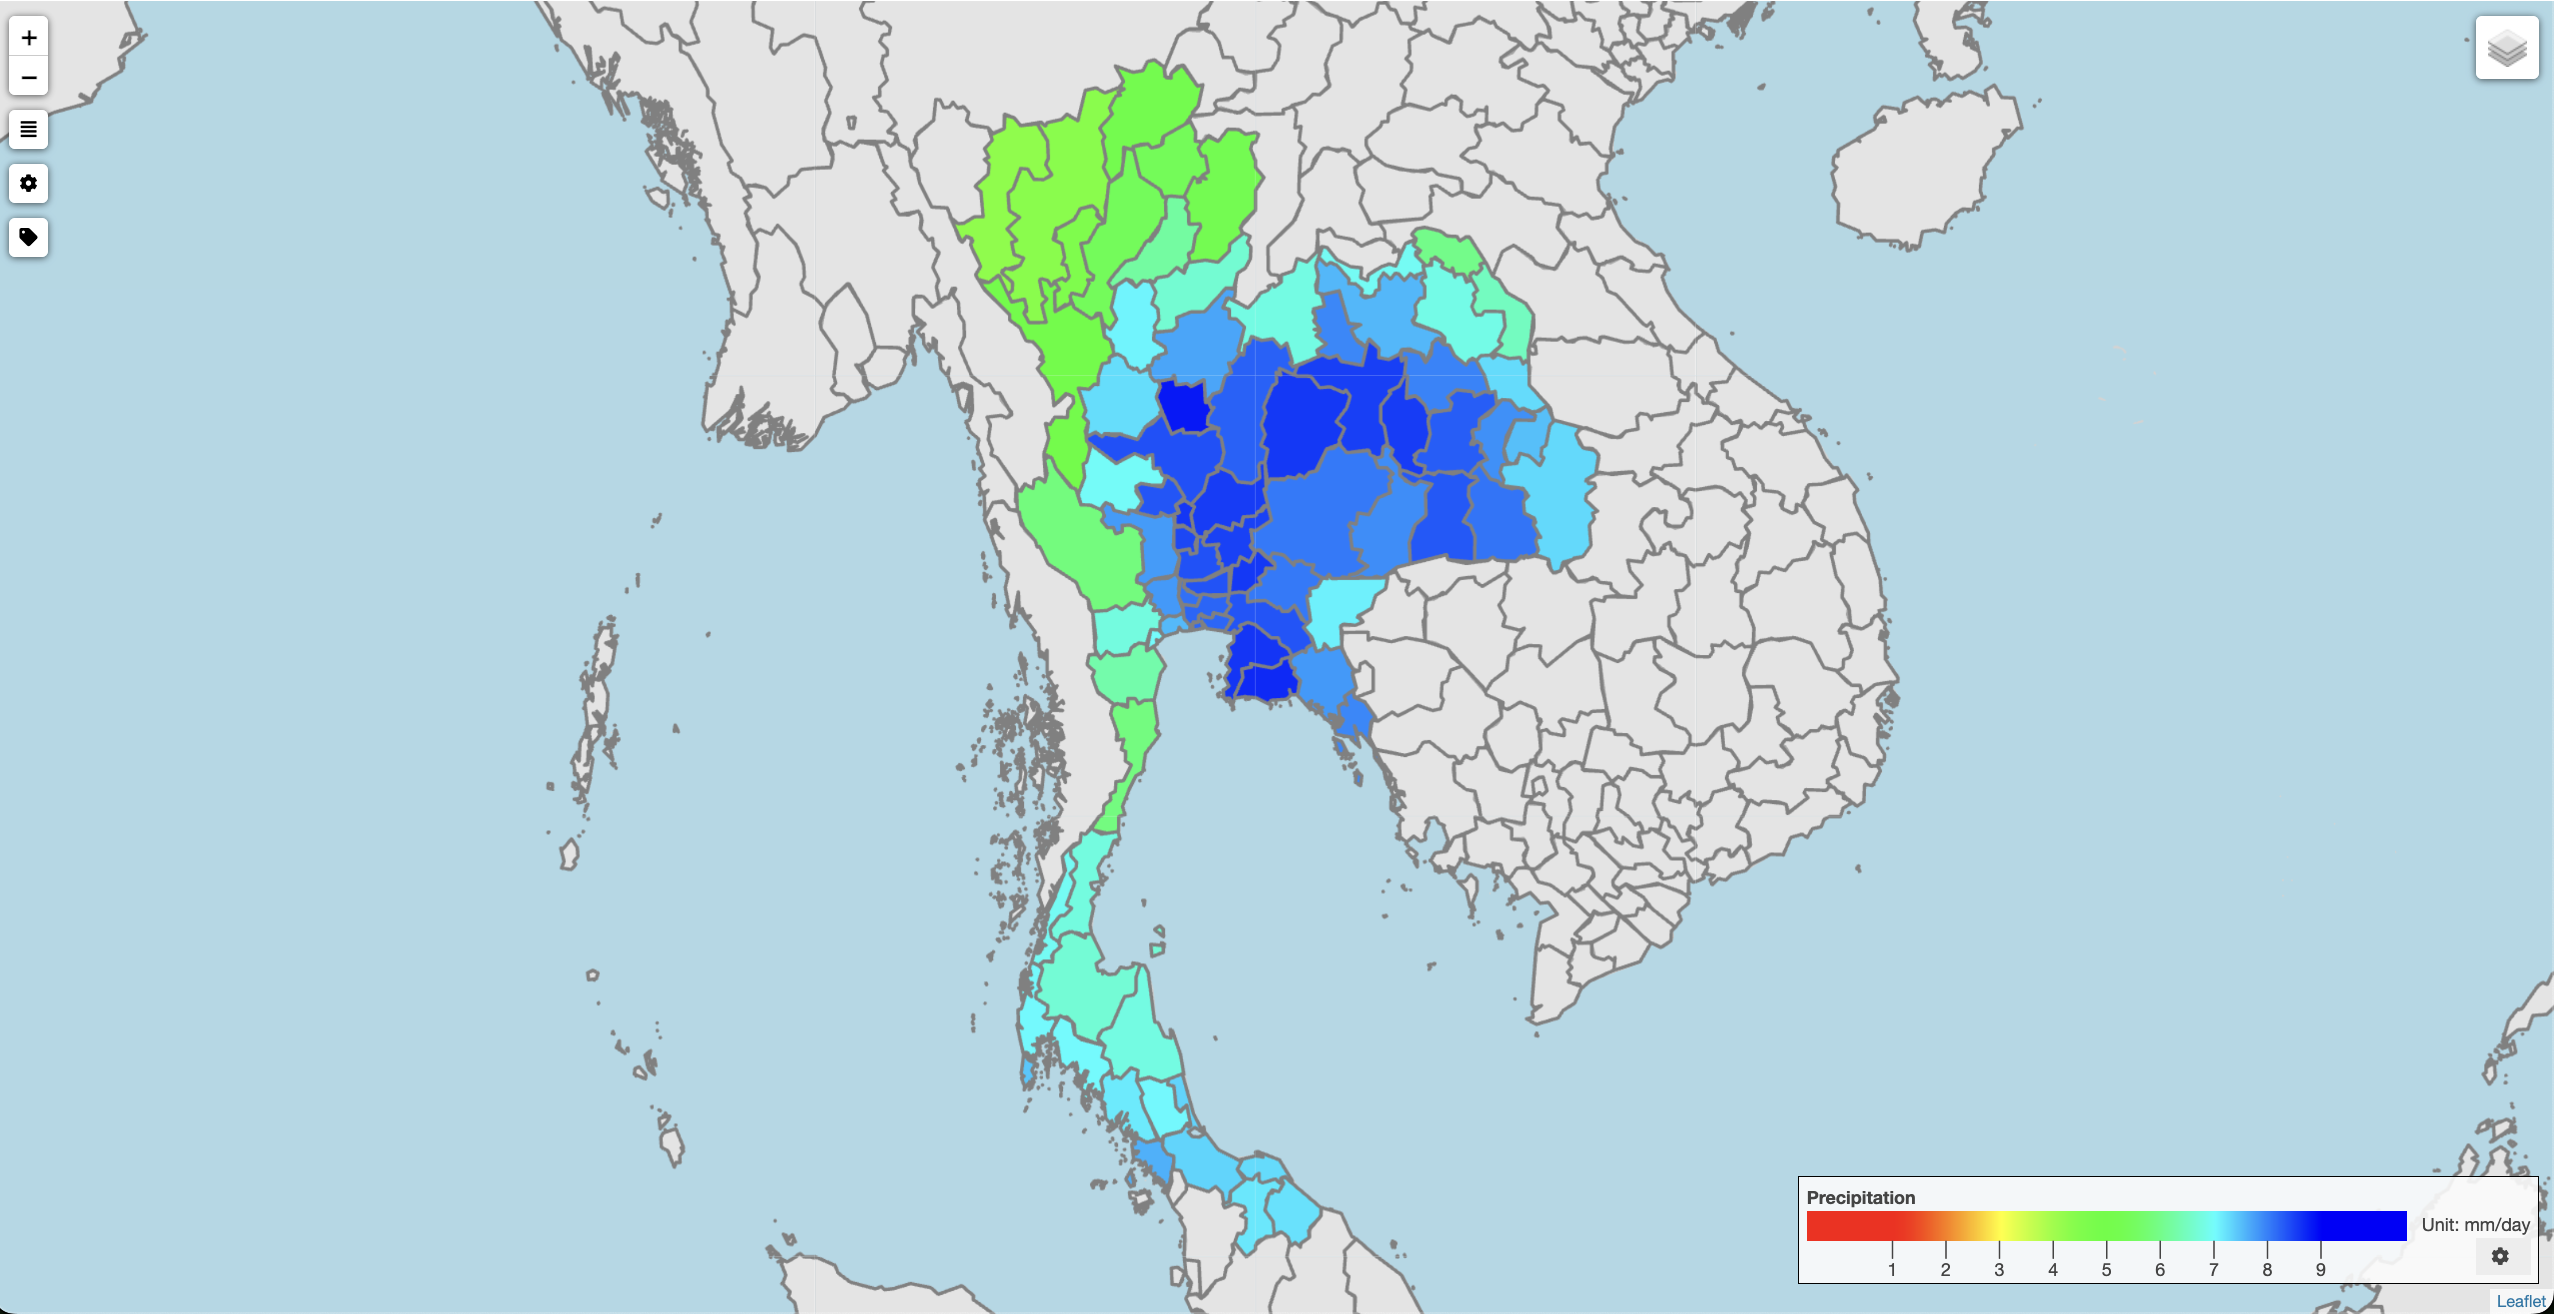
StationMap Viewer
Interactive map showing stations, satellite layers, and gridded data.
Data Overview
A mockup chart showing monthly observations.
AnomalyChart: Regional Climate Warming
Observed, Reanalysis & Projection data showing how much Thailand and SEA are warming compared to the globe (1991-2020 baseline).
Thailand Warming
+1.55°C
Faster than global average
SEA Warming
+1.30°C
Anomaly vs 1991-2020 baseline
Global Warming
+1.15°C
Anomaly vs 1991-2020 baseline
Temperature anomaly (°C) relative to 1991-2020 baseline. Data combines ERA5, CMIP6, and observed station data.
Controls
Select data to display on the dashboard.
Key Statistics
Summary statistics for the selected region and period.